
During the course of our last project, the Meta Quest Pro launched, which brought with it a new mix of capabilities that hasn’t been brought together before: a portable VR headset, with hand and eye tracking, and color passthrough for mixed reality development. We wondered: what new use cases could this headset unlock for merchants?
Looking at hand and eye tracking in particular, we thought - hey, those are the fundamental tools required to run user research studies in retail stores.
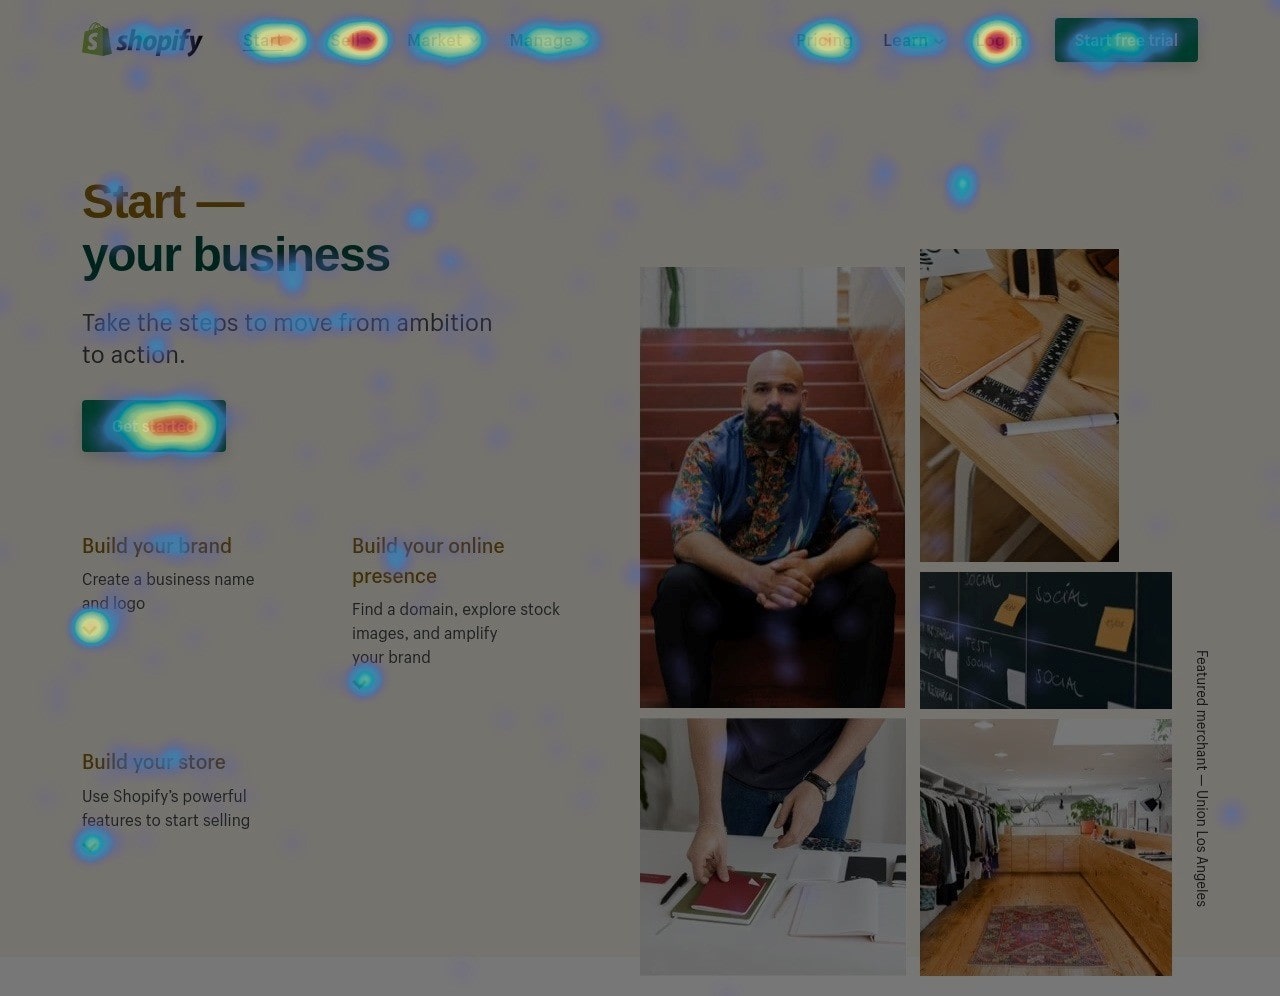
User research studies analyze the behavior of customers as they walk through a store to determine which parts of the store receive the most attention, and which parts are ignored. They use eye tracking and other sources of data to help retailers optimize their physical spaces to better serve customers. You can think of them as Hotjar but in real life.
If a small merchant wants to run user research studies in their store right now, they have many professional options available, but these studies can be expensive and time-consuming, and frankly they seem like a daunting undertaking.
This is one of those areas where larger businesses are able to afford the time and money costs of these studies to optimize, putting small businesses under even more pressure to compete. So then we thought - what if we could send a few Quest Pro’s to a small merchant, and have them collect data in their store with a group of volunteers. Could we use that data to provide the merchant with valuable insights? Could we help them compete?
That’s how we ended up exploring the idea of creating an affordable “retail research kit” with the Quest Pro.
Exploration
We started this project with the broad goal of figuring out how to paint 3D attention heatmaps based on:
- The position of customers within a store.
- The direction in which their eyes look.
- The things that they touch with their hands.
In a sense, we needed a way to turn customers into motion capture performers.
Body, gaze and hand tracking
The first thing we did was write an application that shows the world in color passthrough while it records motion capture data.
We decided to make this application fully unobtrusive by not including virtual hands or any hud elements. Our hope was to make the shopping experience as normal as possible for the research volunteers. They would still need to look at the world through a headset, but the headset would act as a simple pair of glasses, albeit a heavy and bulky pair.
Using the Oculus Movement SDK we were able to record the transform of each eye individually, and using the Oculus Interaction SDK we were able to record the 36 transforms that make up the joints of the hands.
To visualize the data we wrote scripts to read the saved transforms and play them in the Unity editor, and to convert them into an Alembic file so that they could also be played in Blender.
If you watch the previous video carefully, you will notice that the hands occasionally look quite funny, like they do in the image below.
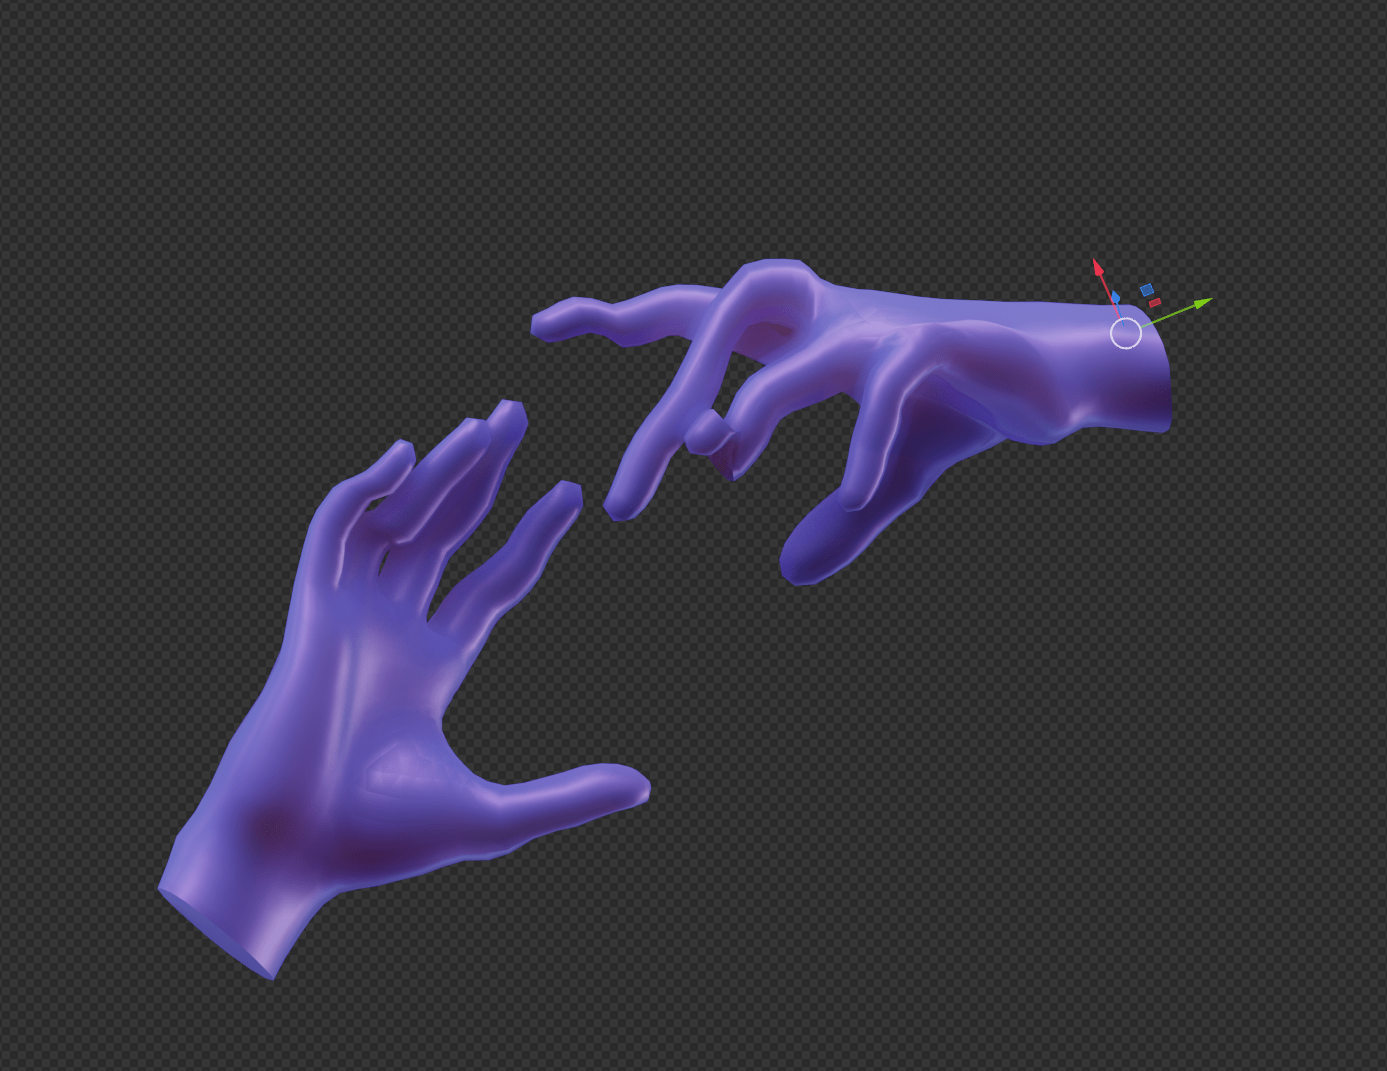
Later on we figured out how to combine the transforms of the joints correctly, and the hands started looking flawless.
Aligning the motion capture data with the store
We now had a way to capture all the data we needed: the position of the customer, their gaze, and the position of their hands.
Now we needed to figure out how to capture the position and orientation of the store, so that when the customer looked at a product, we knew the right place to mark down on the heatmap.
To accomplish this we added an initial step to our app: we would load a pre-scanned 3D model of the store, and we would drag it into alignment with the real store using one of the Quest Pro’s controllers.
During the alignment step we made the model transparent so that it could be easily lined up with the world, and once this step was completed, we made it invisible so that it wouldn’t affect the shopping experience.
Relying on Polycam for the creation of the store’s scan and on the user for the alignment of the virtual and real worlds reduced the complexity of our software enormously.
Visualizing the data
With the 3D model of the store and the aligned motion capture data at our disposal, we could now use this data to drive replays, and those replays could produce visualizations like heatmaps.
At this stage of the project we explored many different ways of visualizing customer walkthroughs. Some of our more unusual ideas include:
- Marking what the customer is currently looking at with concentric circles, and marking their path through the store with a trail of bubbles.
- Marking the things that the customer looks at with spheres.
- Starting with a white store, and marking the things that the customer looks at by revealing their colors.
- Marking the customer’s path through the store with flattened leaves of grass.

- Marking the customer’s path through the store with spheres whose size and color depend on the time spent at each location.
In the end, however, we decided to focus on creating classic heatmaps, since they are easy to read and can pack a lot of detail.
We started by implementing a technique called Mesh Texture Painting to paint 3D models using the mouse.
That technique saves whatever you draw in a texture. In the case of the train above, for example, this is what its texture looks like before and after being painted:
This was perfect for us since we could generate textures for different customer walkthroughs and then compare them and combine them however we wanted.
If you would like to play with the train mesh texture painting demo, it’s live here.
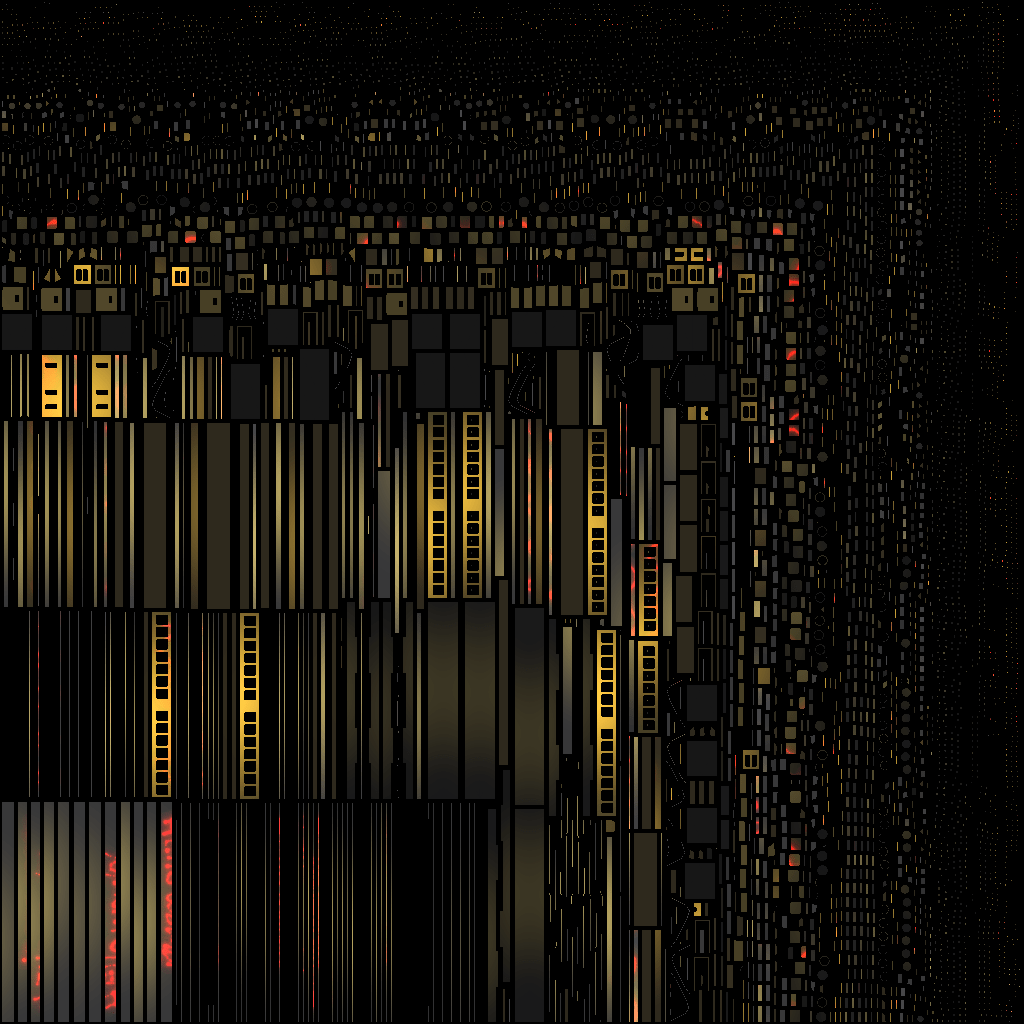
Once we had the mesh texture painting shader working, we modified it to draw different colormaps like Turbo. Now the colors you painted would change depending on how long you held the mouse at the same place, and they would attenuate nicely too.
And then the last step was porting the shader so that it would work in VR. We started by replacing the mouse with a Quest Pro controller, and then we replaced the Quest Pro controller with the gaze vector. It’s an amazing feeling to paint with your eyes. You feel like Marvel’s Cyclops while doing it.
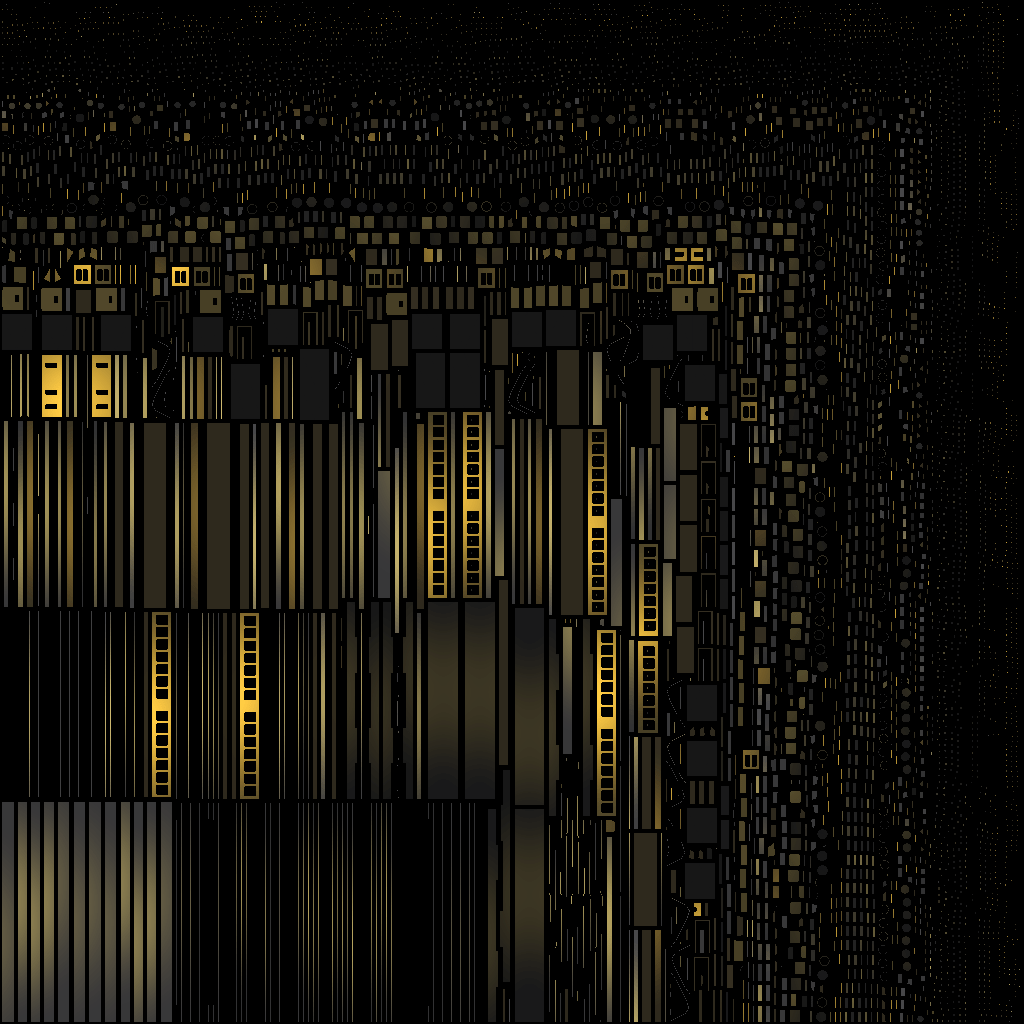
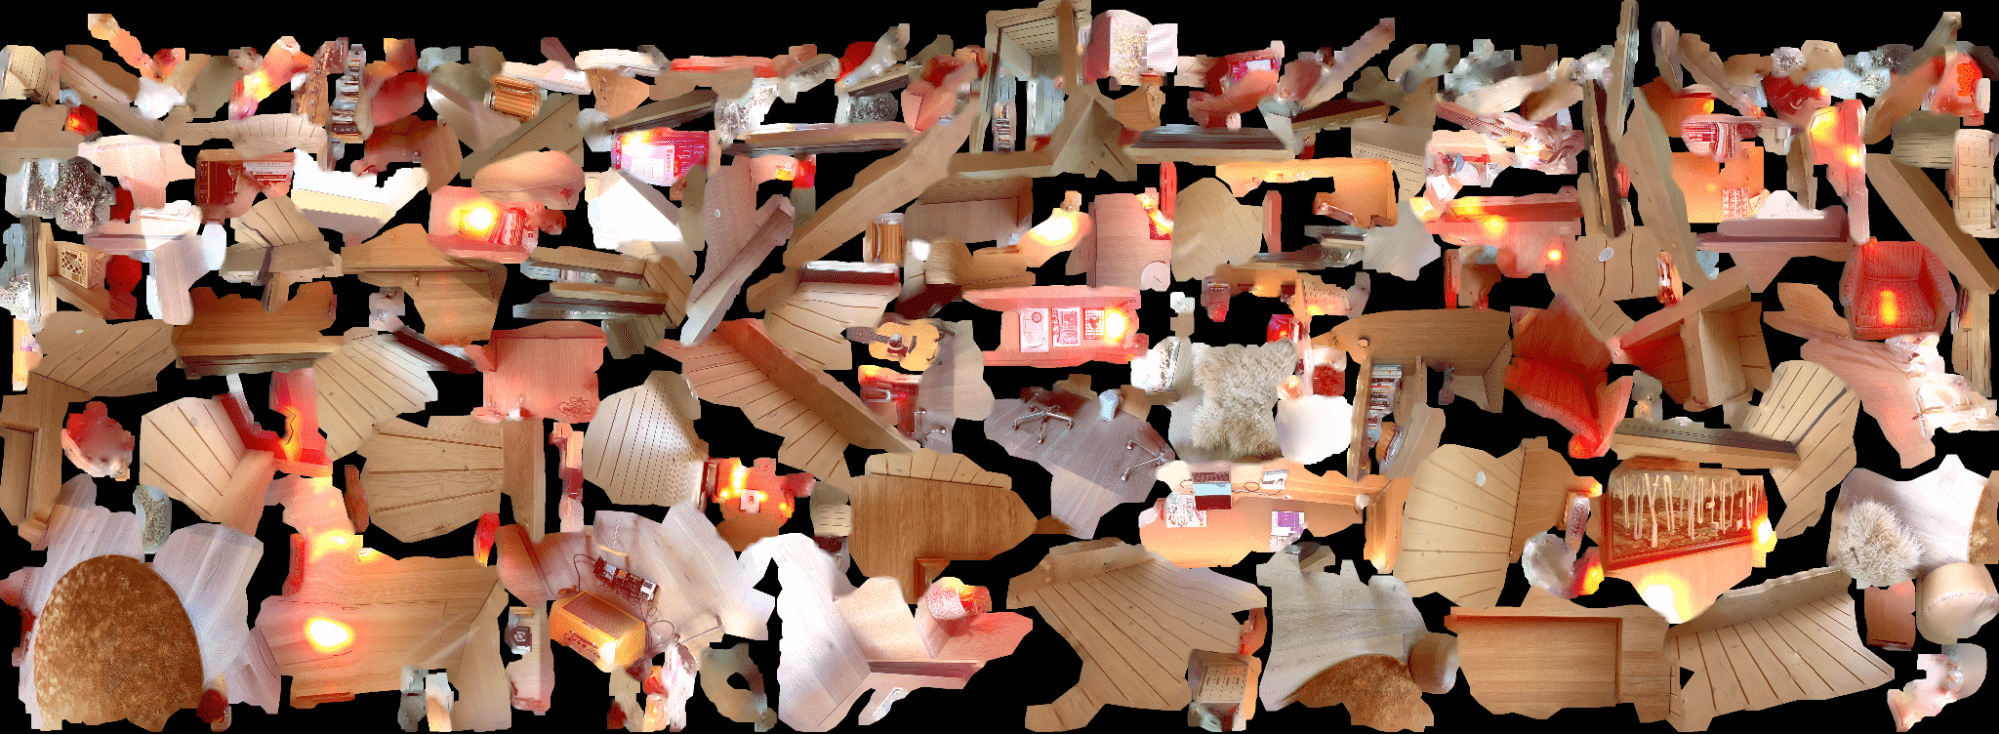
Here’s what the texture of one of our office’s looked like after being painted with the gaze vector:
The last thing we did was implement a mode in the app that allowed merchants to overlay painted textures on top of their real stores in color passthrough. We thought this was a very engaging way of visualizing the data. Merchants could walk through their stores and approach hot spots to understand what products were drawing the most attention.
Decoupling the process of analysis from the process of capture worked great for this project. We could use the results that were taken yesterday to gain further insights today. And when we had a new idea about how to better visualize the data, we could go back and use existing data to validate and check our insights.
In-store trial (and error)
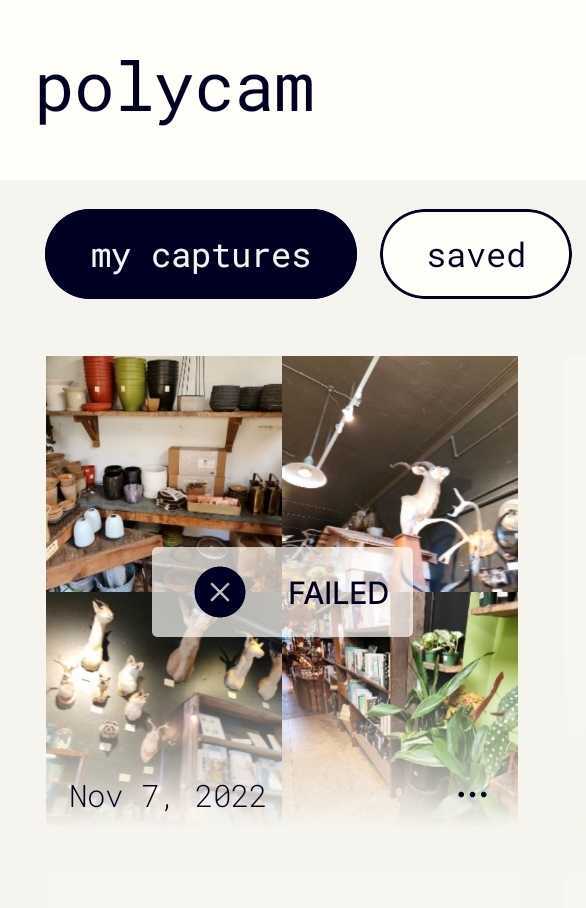
With all of this working, we were ready to give this idea a trial run. We offered some compensation for volunteer’s time, called local Shopify stores in our area, and we found that a local store called Paxton Gate was as eager as we were to find out more. We’d have to scan the store into a 3D model first, then load that into our app so that we could do the alignment and begin recording.
Unfortunately our initial scans of the store failed. We tried different iOS and Android phones, but we kept getting the same errors. Paxton Gate was simply too large and too complex for Polycam.
We then decided to only scan three quarters of the store, which allowed us to get a 3D model that we could use in our app.
After completing a few volunteer walkthroughs we looked at the motion capture data we had captured, and we found that the Quest Pro’s eye tracking had occasionally failed too. We think this is because we didn’t run the Quest Pro’s eye tracking calibration app for each volunteer. It’s important to make sure that the headset is properly adjusted for each unique individual.
Even with all those problems, we were able to successfully capture a few volunteer walkthroughs. We then spent the next few days analyzing the data and generating all kinds of visualizations.
Here’s an actual volunteer walking through Paxton Gate:
Everything you see in that video was mocapped, and the heatmap on the walls is the result of combining the walkthrough data of multiple volunteers.
Here’s another volunteer browsing through some water bottles and cards:
And here’s the combined heatmap overlaid on top of the real Paxton Gate in color passthrough:
The different ways one can visualize the data are truly endless.
Conclusions
When everything is working, this is a valuable and magical tool for merchants. It allows small businesses to compete with even the largest corporations in doing user research studies, and it’s all done using technology that’s within reach today.
One can even imagine a future where merchants not only have 3D scans of their stores, but of every single product within them, which would allow this tool to keep track of all the products that a customer interacts with with great precision.
That would unlock new insights like “what parts of this product draw the most attention?”
For a merchant who’s never had easy access to this type of technology, this is now a huge opportunity.