Detailed design documentation
mybench: a high-performance framework for rapid prototyping of benchmarks
November 2022
Introduction
Database performance analysis is a difficult and time-consuming aspect of the maintenance and evolution of today’s cloud-based applications. One common method of conducting performance analysis is to benchmark the database with a simulated load that matches what is observed in production. Database benchmarks are typically conducted against database servers that are created in a controlled environment with similar specification and topology as the production databases. A simulated data set is then loaded into the database servers. Finally, a simulated workload is sent to the database servers. The resulting throughput and latency metrics are recorded and subsequently analyzed to identify limitations of the system and opportunities for optimization.
To properly perform these benchmarks, implementations of the simulated data sets and workloads must realistically represent the production system. Since most modern web applications are somewhat uniquely implemented, custom simulated data set and workload must be modeled to accurately represent each application. Since many modern web applications consist of a number of “microservices” each with its own codebase, databases, and query patterns, many simulated data sets and workloads must be modeled and benchmarked to properly gain insights into the performance of the application as a whole. The benchmark tool must therefore provide an easy-to-use and ergonomic API to model these data sets and workloads. This is termed as the pre-processing stage of the benchmark [1].
Following the pre-processing stage, the simulated workload must be executed by the benchmarking tool in the processing stage. One technique to discover the limits of the system is to drive the workload with increasing rate until throughput saturates and latency spikes. This requires the benchmark tool to precisely and accurately control the rate at which the workload is sent to the database. As the rate increases, the amount of work the benchmark tool has to do also increases, which can negatively and artificially affect the throughput and latency. To avoid this, the benchmark tool itself must be very efficient, and ideally detects that its own performance is compromised by the high desired rate. To shorten the feedback loop in case something is wrong with the benchmarking setup, it is also important for the tool to provide a live monitoring of throughput and latency values such that engineers can detect problems while the benchmark is in progress and abort the run if necessary.
Once the benchmark completes, a large amount of data would be generated, and they must be analyzed in the post-processing stage. Throughput and latency values collected through the benchmark should be visualized in a standardized manner such that results from different benchmarks can be more easily compared. The benchmark tool should thus provide a standard set of visualization and analysis tools to speed up the interpretation of the benchmark results.
While a number of database benchmark tools such as sysbench [SYSBENCH01], benchbase [BENCHBASE01], and linkbench [LINKBENCH01] are available, none of these tools fulfill all the requirements outlined above. The work presented here is our attempt to solve all of these problems in a single software package we named “mybench”.
Requirements
The following requirements were developed during the design process of mybench:
The software should get out of the user’s way where possible.
Benchmark prototyping is convenient and ergonomic to encourage users to develop custom benchmarks.
Running a benchmark is convenient and ergonomic.
Executing mybench-internal code should not impact the throughput and latency of the workloads.
Multiple workloads can be mixed to better emulate production traffic where multiple groups of query patterns exist.
Accurate and precise control of the query (a.k.a. event) rates for each workload.
Live monitoring of throughput and latency statistics.
Logging of throughput and latency time series during the benchmark run in standardized data formats.
Standardized plots to visualize the results post-benchmarking.
mybench design
Internal architecture
mybench is a Golang library that enables developers to create, run, and analyze benchmarks. To minimize the efforts required to define a benchmark, the top-level API is kept small and much of the complexities of running a benchmark is implemented within mybench. Figure 1 depicts the internal architecture of mybench.

Figure 1: mybench architecture showing 3 Workloads each running with two
BenchmarkWorkers
mybench defines a Benchmark to consist of multiple Workloads. At least
one Workload must be defined for a Benchmark. Each Workload is defined by its
Event callback, within which contains the code being benchmarked. For
example, the Event callback for one workload could implement a sequence of
queries that is typical for a web request to a particular API endpoint while
the Event callback for another workload could implement a different
sequence of queries that is typical for a different API endpoint. In the
figure, three such workloads are mixed together during the benchmark. Each
workload is configured by the number of parallel BenchmarkWorkers executing
the events and an overall event rate. In the figure, all three workloads are
configured to be executed with two parallel BenchmarkWorkers. The splitting
of workload into multiple parallel workers is useful for simulating scenarios
where many connections are sending queries to the database simultaneously.
BenchmarkWorkers are implemented as goroutines each with its own connection
to the database. The overall event rate is equally divided between all
BenchmarkWorkers. Each BenchmarkWorker embeds a Looper object,
which precisely controls the event rate (see Rate control via
“temporal-discretization” looper), and an OnlineHistogram object, which
stores the throughput and latency statistics during the benchmark run. Data
held inside the OnlineHistogram objects are periodically read by the
DataLogger (see High-performance data logging via double buffering).
Once the data is read, the DataLogger aggregates the throughput and latency
statistics across all BenchmarkWorkers and all Workloads into
per-workload and overall throughput and latency statistics. These values are
then written into a SQLite database.
Users developing a custom benchmark do not need to be concerned with the
internal details of mybench. To define a Workload, the user needs to
define a struct implementing the WorkloadInterface interface, which
requires the definition of the Event callback, a Config method
returning the configurations of the workload (such as the event rate and number
of parallel workers), and a NewContextData method that constructs a
custom, thread-local data structure that could be useful for the workload to
store thread-local state. Each custom benchmark is tied together with a
BenchmarkApp which constructs and owns the Benchmark object. Workloads
defined by the user can be added to the Benchmark through the
BenchmarkApp object.
The BenchmarkApp also handles other administrative duties common
between all custom-defined user benchmarks, such as parsing the command line
flags and setting an HTTP server where live throughput and latency statistics
can be monitored.
Rate control via “temporal-discretization” looper
A common approach to discover the limits of the database is by performing a sequence of benchmarks with increasing event rates. When the database is overloaded, the event rate will plateau or decline and the latency will increase. To perform this type of benchmarks, an accurate and precise rate controller is required. One naive approach to implement such a controller would be executing the event code followed by a sleep in a simple loop. The sleep duration can be calculated to match the requested event rate. However, maintaining a loop with a loop rate beyond 500 - 1000 Hz is difficult due to scheduling latencies incurred by the Linux process scheduler without the real-time patch applied. Additionally, Go’s goroutine scheduler can introduce additional latencies on the order of about 3 ms (based on experimental testing while developing mybench), which further increases the difficulties of maintaining a high event rate.
Thus, instead of calling Event once per loop iteration, mybench implements
two nested loops where the inner loop calls Event multiple times while the
outer loop maintains a constant and relatively low outer loop frequency of 50 Hz
(by default). The number of Event calls is calculated by simulating the
arrival of events within the outer loop iteration based on the desired event
rate by sampling from either a uniform or a Poisson distribution. Figure 2a
depicts this sampling process with a uniform event arrival distribution. After
calling Event in the inner loop, the looper sleeps until the next scheduled
wake-up time according to the outer loop frequency, when it then repeats the
same process for the next iteration.

Figure 2: The temporal-discretization scheme mybench rate controller a) in
normal operating circumstances and b) when the events are too slow to keep at
a desired event rate. Each box is an Event call.
In cases where Event call durations are too long to maintain a particular
desired event rate, the looper will detect this overrun and switch into an
overload mode (Figure 2b) where each outer loop iteration only calls Event
once. The sleep between successive outer loop iterations is also removed to
maximize the event rate. The looper detects this overrun effectively by tracking
the number of events it should have executed based on the desired event rate
since the start of the run and compare it against the number of events it has
actually executed [2]. If the number of events executed is lower
than the number of events it should have executed, the looper switches into the
overload mode. If at any point the actual number of events executed catches
up with the expected number of events, the looper will switch back into its
normal mode where events are batched. This system allows the looper to maintain
the average event rate over a long period of time in cases where the Event
call duration momentarily increases beyond the threshold at which the desired
event rate could no longer be sustained.
High-performance data logging via double buffering
The throughput and latency values of the Event calls are recorded into an HDR
histogram [HDRHIST01], which is a data structure that can accurately track
histogram distributions with low memory and CPU overheads. Each
BenchmarkWorker records the latency value of each Event call in its own
instance of the HDR histogram, which is embedded the OnlineHistogram struct
that also provides the capability to track the event throughput. Data in all
OnlineHistogram instances are collected and aggregated every one second such
that throughput and latency statistics over the course of the benchmark are
monitored as time series. Since each OnlineHistogram instance is
continuously accessed and modified by their respective BenchmarkWorker
goroutines, data collection must not introduce additional latencies or data races
to the main event loop. Further, as mybench can simultaneously run hundreds of
BenchmarkWorker goroutines each with its own instance of
OnlineHistogram, the time required to access all OnlineHistogram
instances must be short enough to not bias the calculation for the overall
throughput of the benchmark [3].
To satisfy these requirements, OnlineHistogram is implemented as a double
buffer of the underlying HDR histogram objects. Figure 3 shows this double
buffer in operation. While the benchmark loop runs, the worker writes to the
active slot 1 of the double buffer (Figure 3a). Periodically, the data logger
takes a snapshot of the data for all BenchmarkWorkers. This is implemented
by swapping the active and inactive slot (Figure 3b). To avoid data races, a
per-worker mutex guards both writing to the active slot and the double buffer
swap operation. The swap operation is very fast, as it simply updates index
pointing to the current active slot. Immediately after the swap, the
BenchmarkWorker is unblocked and all data is now written to the newly active
slot 2 (Figure 3c). This occurs while the data logger finally reads the data
from the HDR histogram residing in the now-inactive slot 1. After data from all
BenchmarkWorkers are read, the data logger resets the histograms in the
inactive slots to a zero state such that they can be reused following the next
swap.

Figure 3: OnlineHistogram as it is a) being written to while the data
logger is idling; b) performing the swap when the data logger takes a
data snapshot for all BenchmarkWorkers; and c) being written to after
the swap and while the data logger reads from the inactive slot.
Once the data is collected, the per-workload and aggregate throughput and
latency data are written into a SQLite database on disk. Each benchmark run
occupies a single table in the SQLite database. Meta information about the
benchmark run, such as the benchmark start and stop time, is written to a table
named meta. The choice of a SQLite database allows data from a series of
benchmark runs to be stored in a single file, which can simplify the transport,
storage, and post-processing of the data.
Data generation
Database benchmarks require the generation of data. Similar to other
benchmark systems, mybench also provides a number of built-in data generators
that can generate data with different types and distributions. All data
generators implement an interface with two methods: (1) one for the generation of
“new” data to be written to the database and (2) one for sampling data
that already exists on the database such that the data can be used in the
WHERE clause of a SELECT statement. At this time, the data generators
implemented within mybench are relatively primitive. For example, accurately
sampling existing data can be memory and time intensive and mybench does not
implement a fully-correct version of the existing data sampling algorithm at
this time. Instead, data sampling is done in a best-effort manner to ensure
the high performance and small resource footprint of mybench is not
compromised.
The random data generators implemented in mybench use the standard rand
library from Go’s standard libraries. The default random number generator
implemented in the rand library uses a global random source protected by a
global mutex. Since random data generation are performed concurrently from
every worker, the global mutex protecting a default global random source would
create a significant performance bottleneck. Thus, instead of using the default
random source provided in Go’s standard library, each BenchmarkWorker has its
own instance of the random source and eliminates the need for a mutex.
Live monitoring user interface
mybench implements a web-based user interface that displays time series for throughput and latency of the running benchmark in real-time. Every five seconds, the user interface requests the throughput and latency time series for the current benchmark via HTTP. These time series are gathered by the data logger periodically and stored within a ring buffer. Visualization of the time series is implemented with the VegaLite visualization framework [VEGA01]. This user interface allows users to identify issues with their custom benchmarks more quickly and therefore shortens the overall time required to develop and conduct benchmarks. Figure 4 shows a screenshot of this user interface.
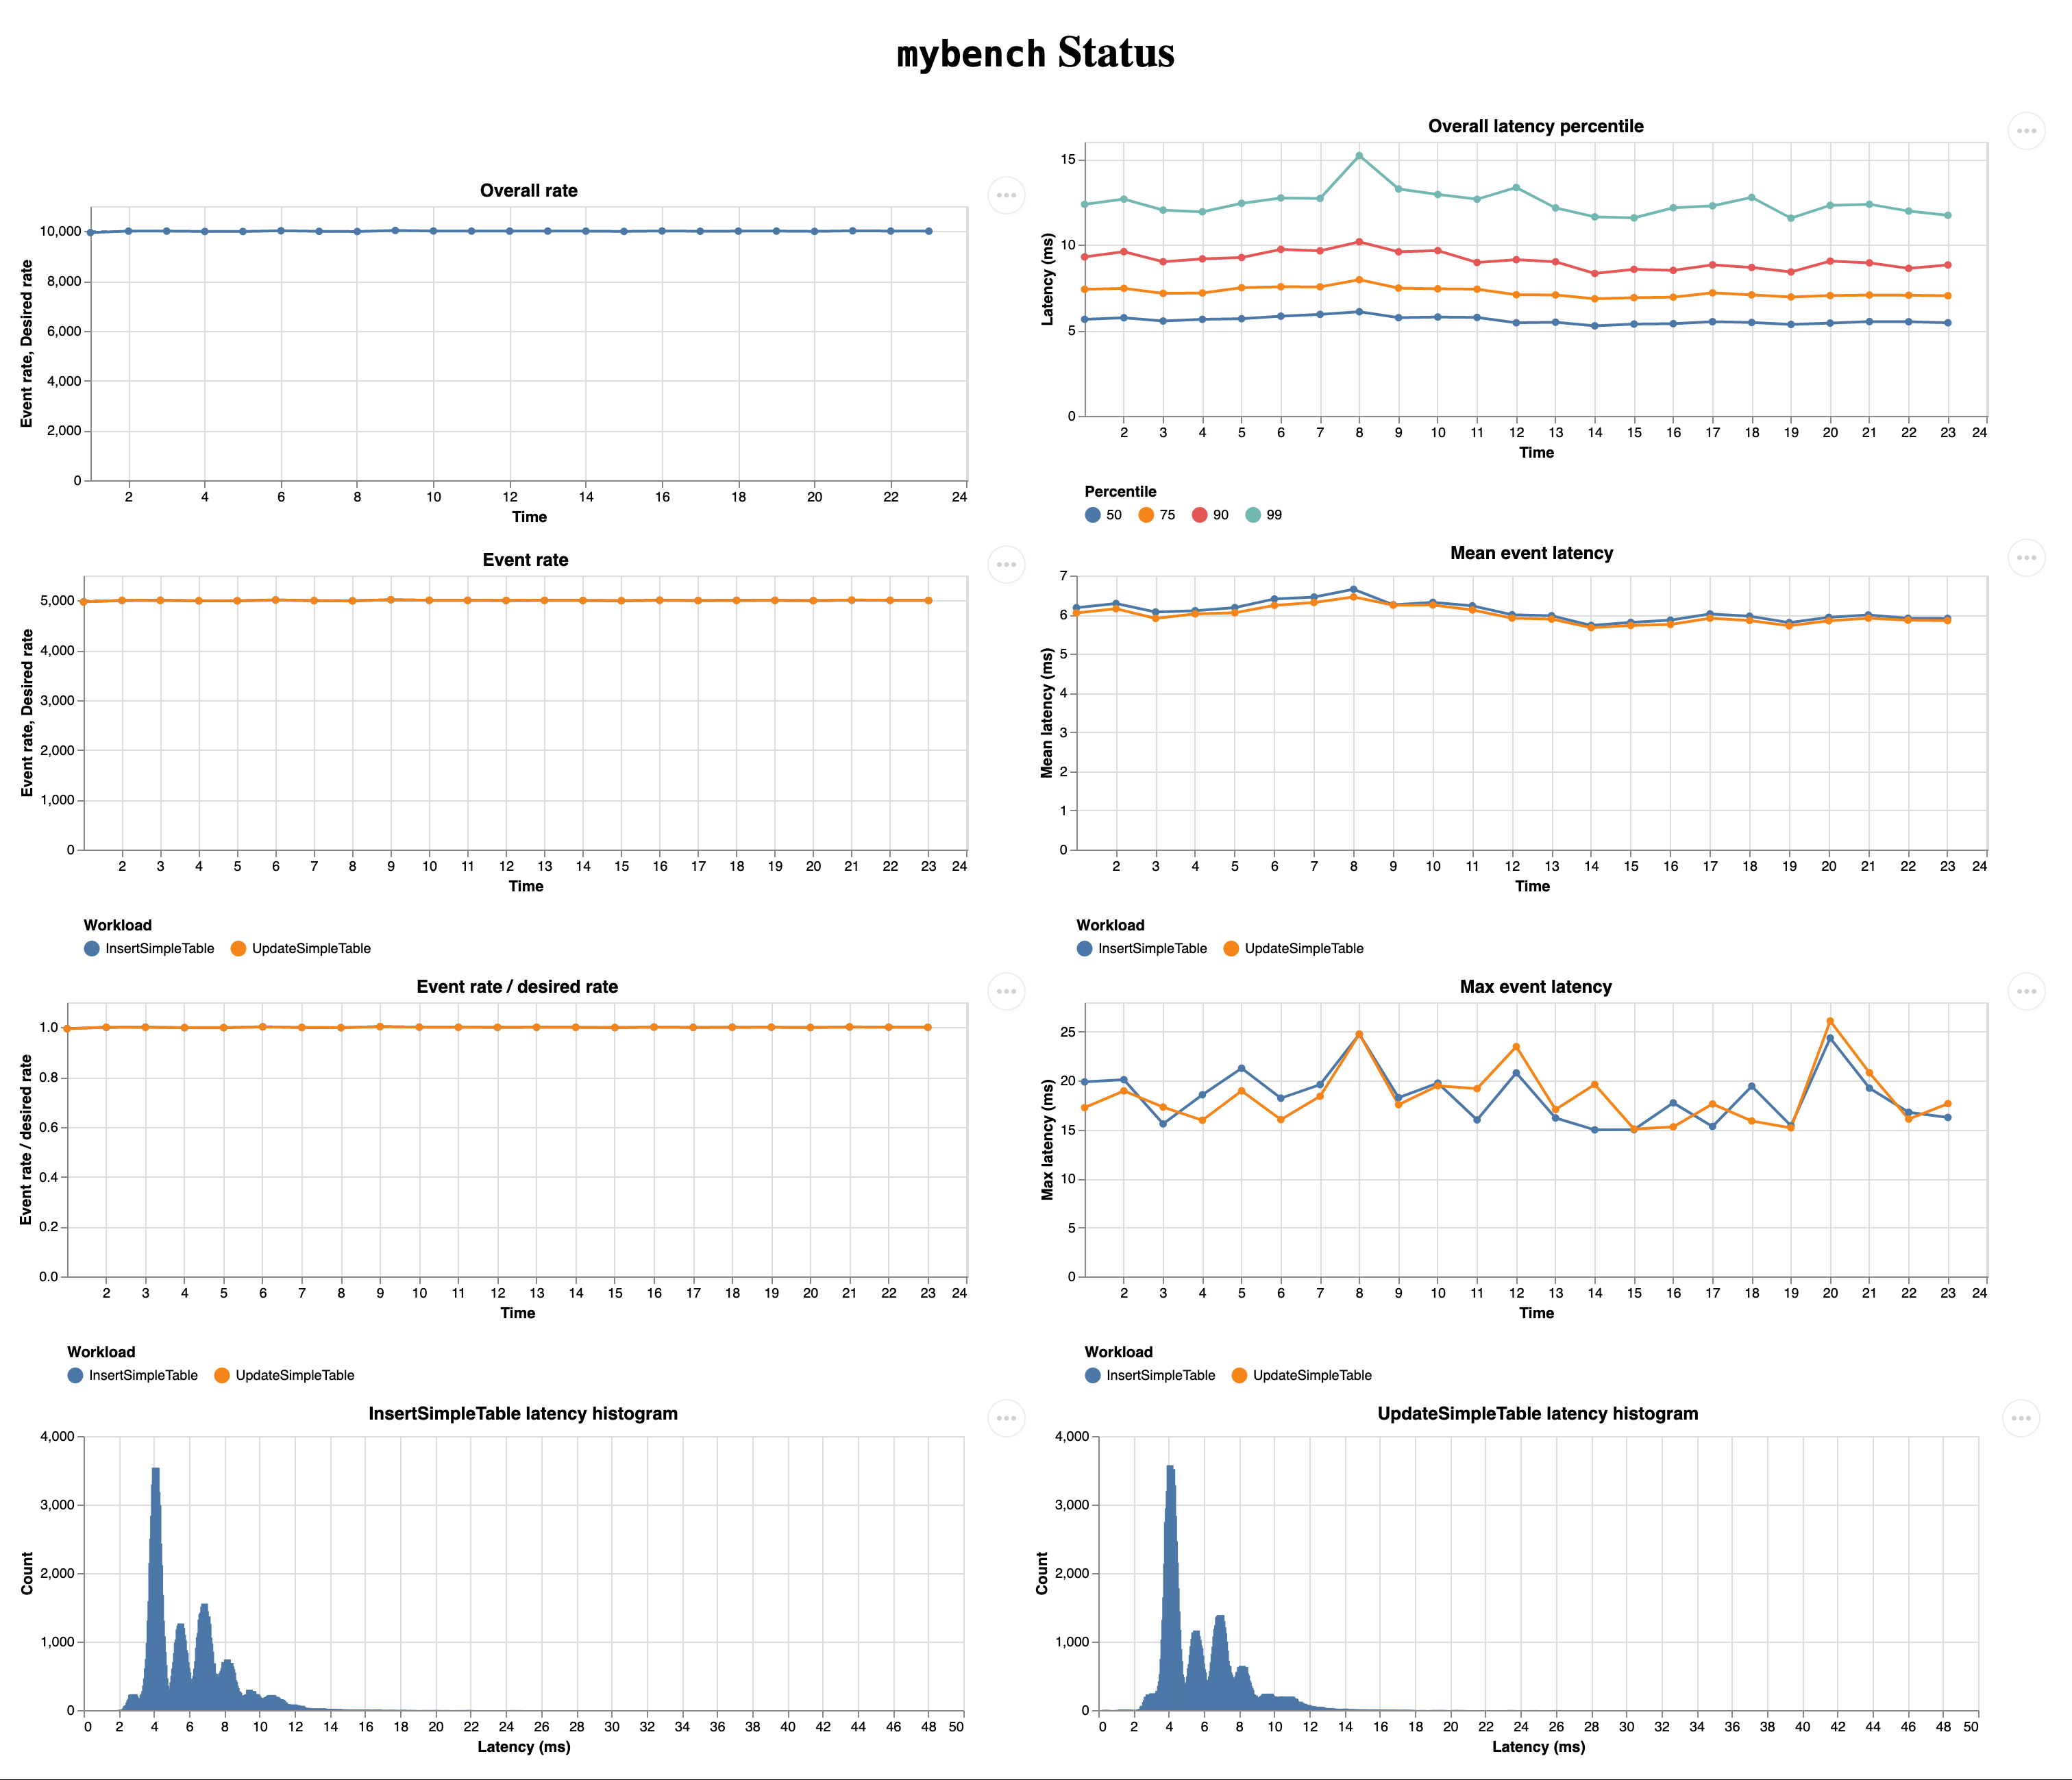
Figure 4: A snapshot of the live monitoring user interface
Post-processing tools
mybench includes a suite of post-processing utilities that can generate plots to visualize a benchmark run’s throughput and latency statistics. Multiple benchmark runs can also be visualized on the same figure to better compare them. Figure 5 shows an instance of this comparison with a sequence of benchmark runs where the desired throughput is increased from run to run.
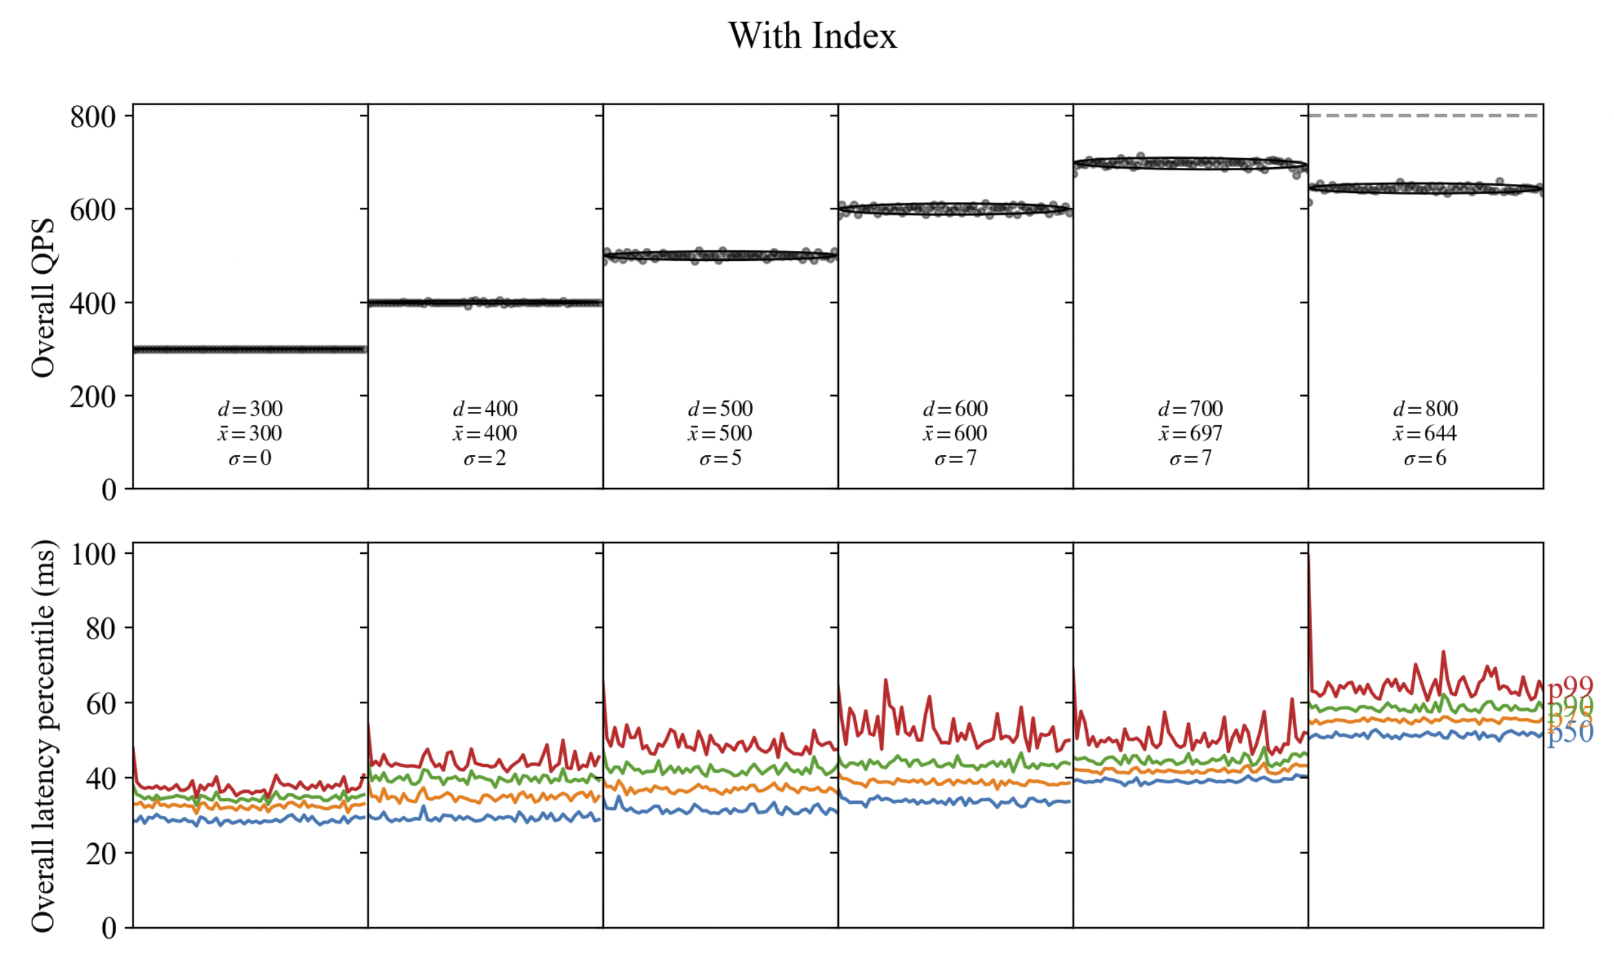
Figure 5: A figure generated by the post-processing tools that show the throughput and latency of a sequence of benchmarks with increasing desired throughput (d).