Reporting to analytics
As was mentioned in Render Pass Reports chapter, every time a profiled screen is rendered, the library emits a RenderPassReport object that can be accessed in the onReportPrepared callback of the PerformanceProfiler component. Through this callback, one can report the reports to a telemetry service. On this page, we will see an example of how to send Render Pass Reports to Amplitude.
Amplitude
After integrating Amplitude React Native SDK, you only need one line to pass the event from onReportPrepared callback to Amplitude:
tsx
tsx
Once you’ve got the events on your dashboard, you can set the monitoring to show how your screens perform with the time. There is also a possibility to add a breakdown of rendering steps and how long they took to make it easier to identify the bottlenecks.
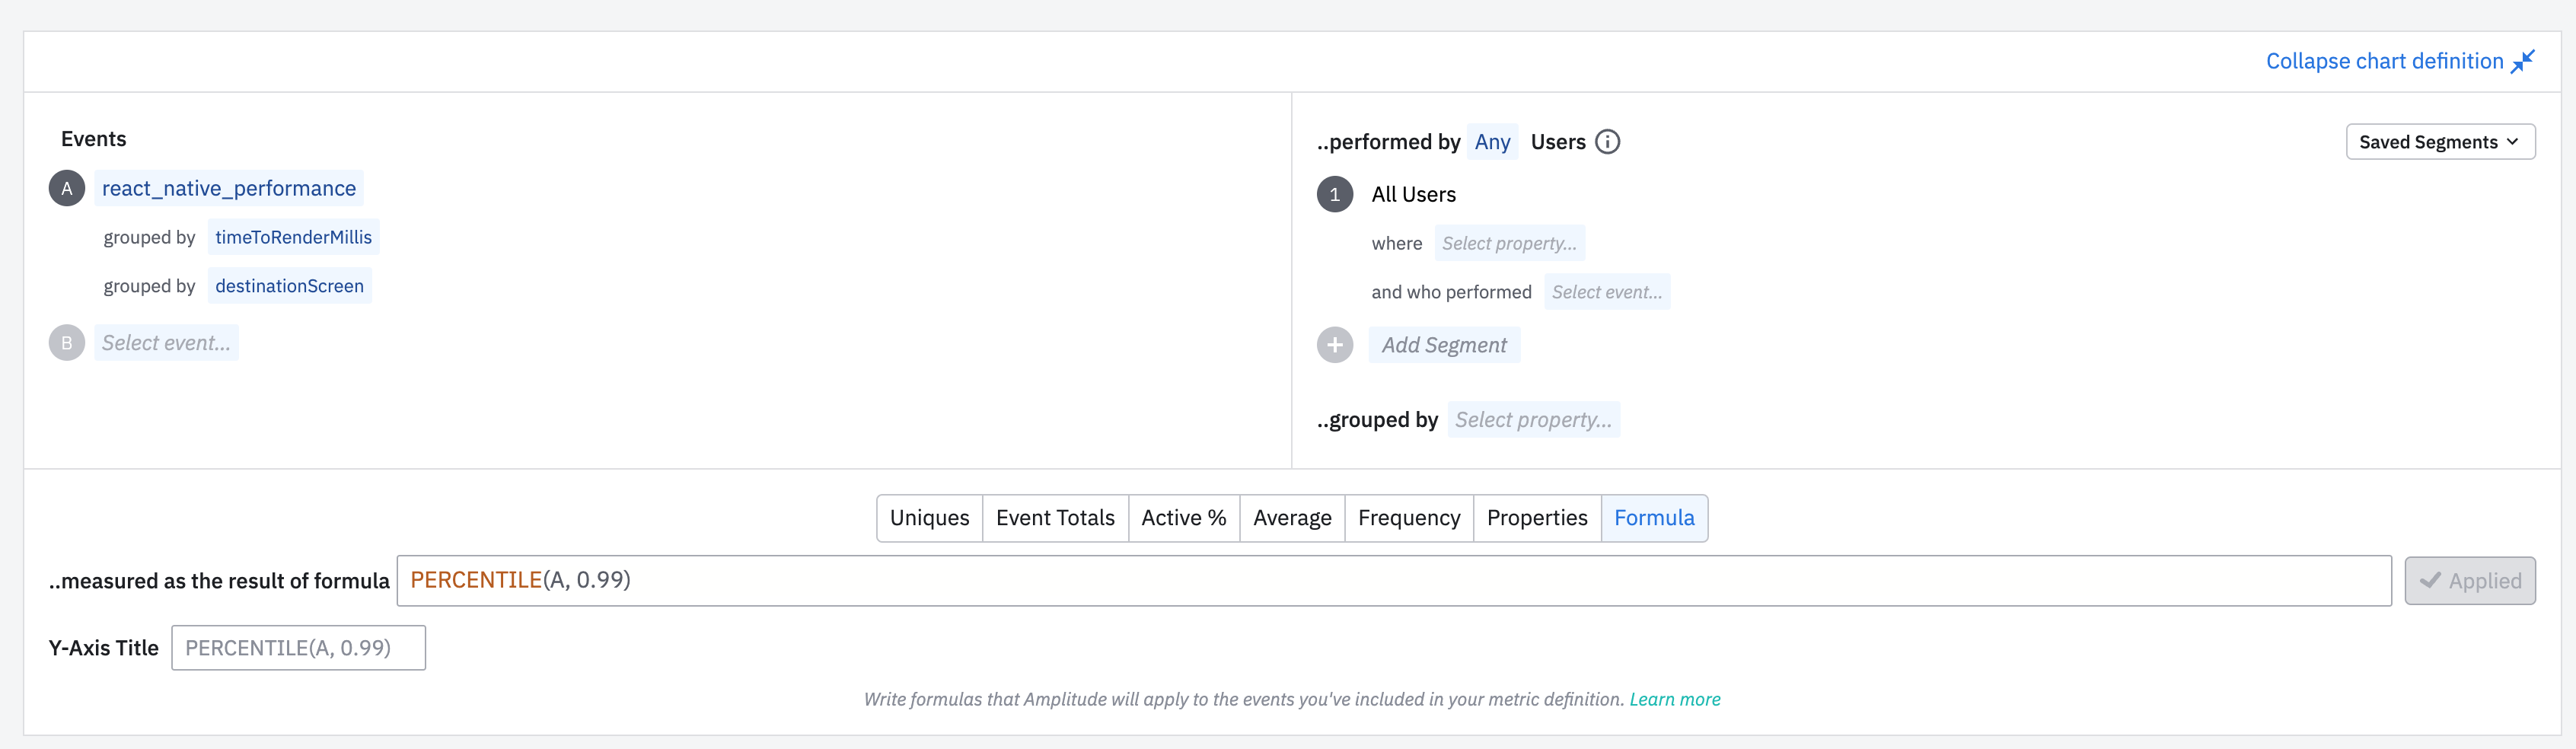
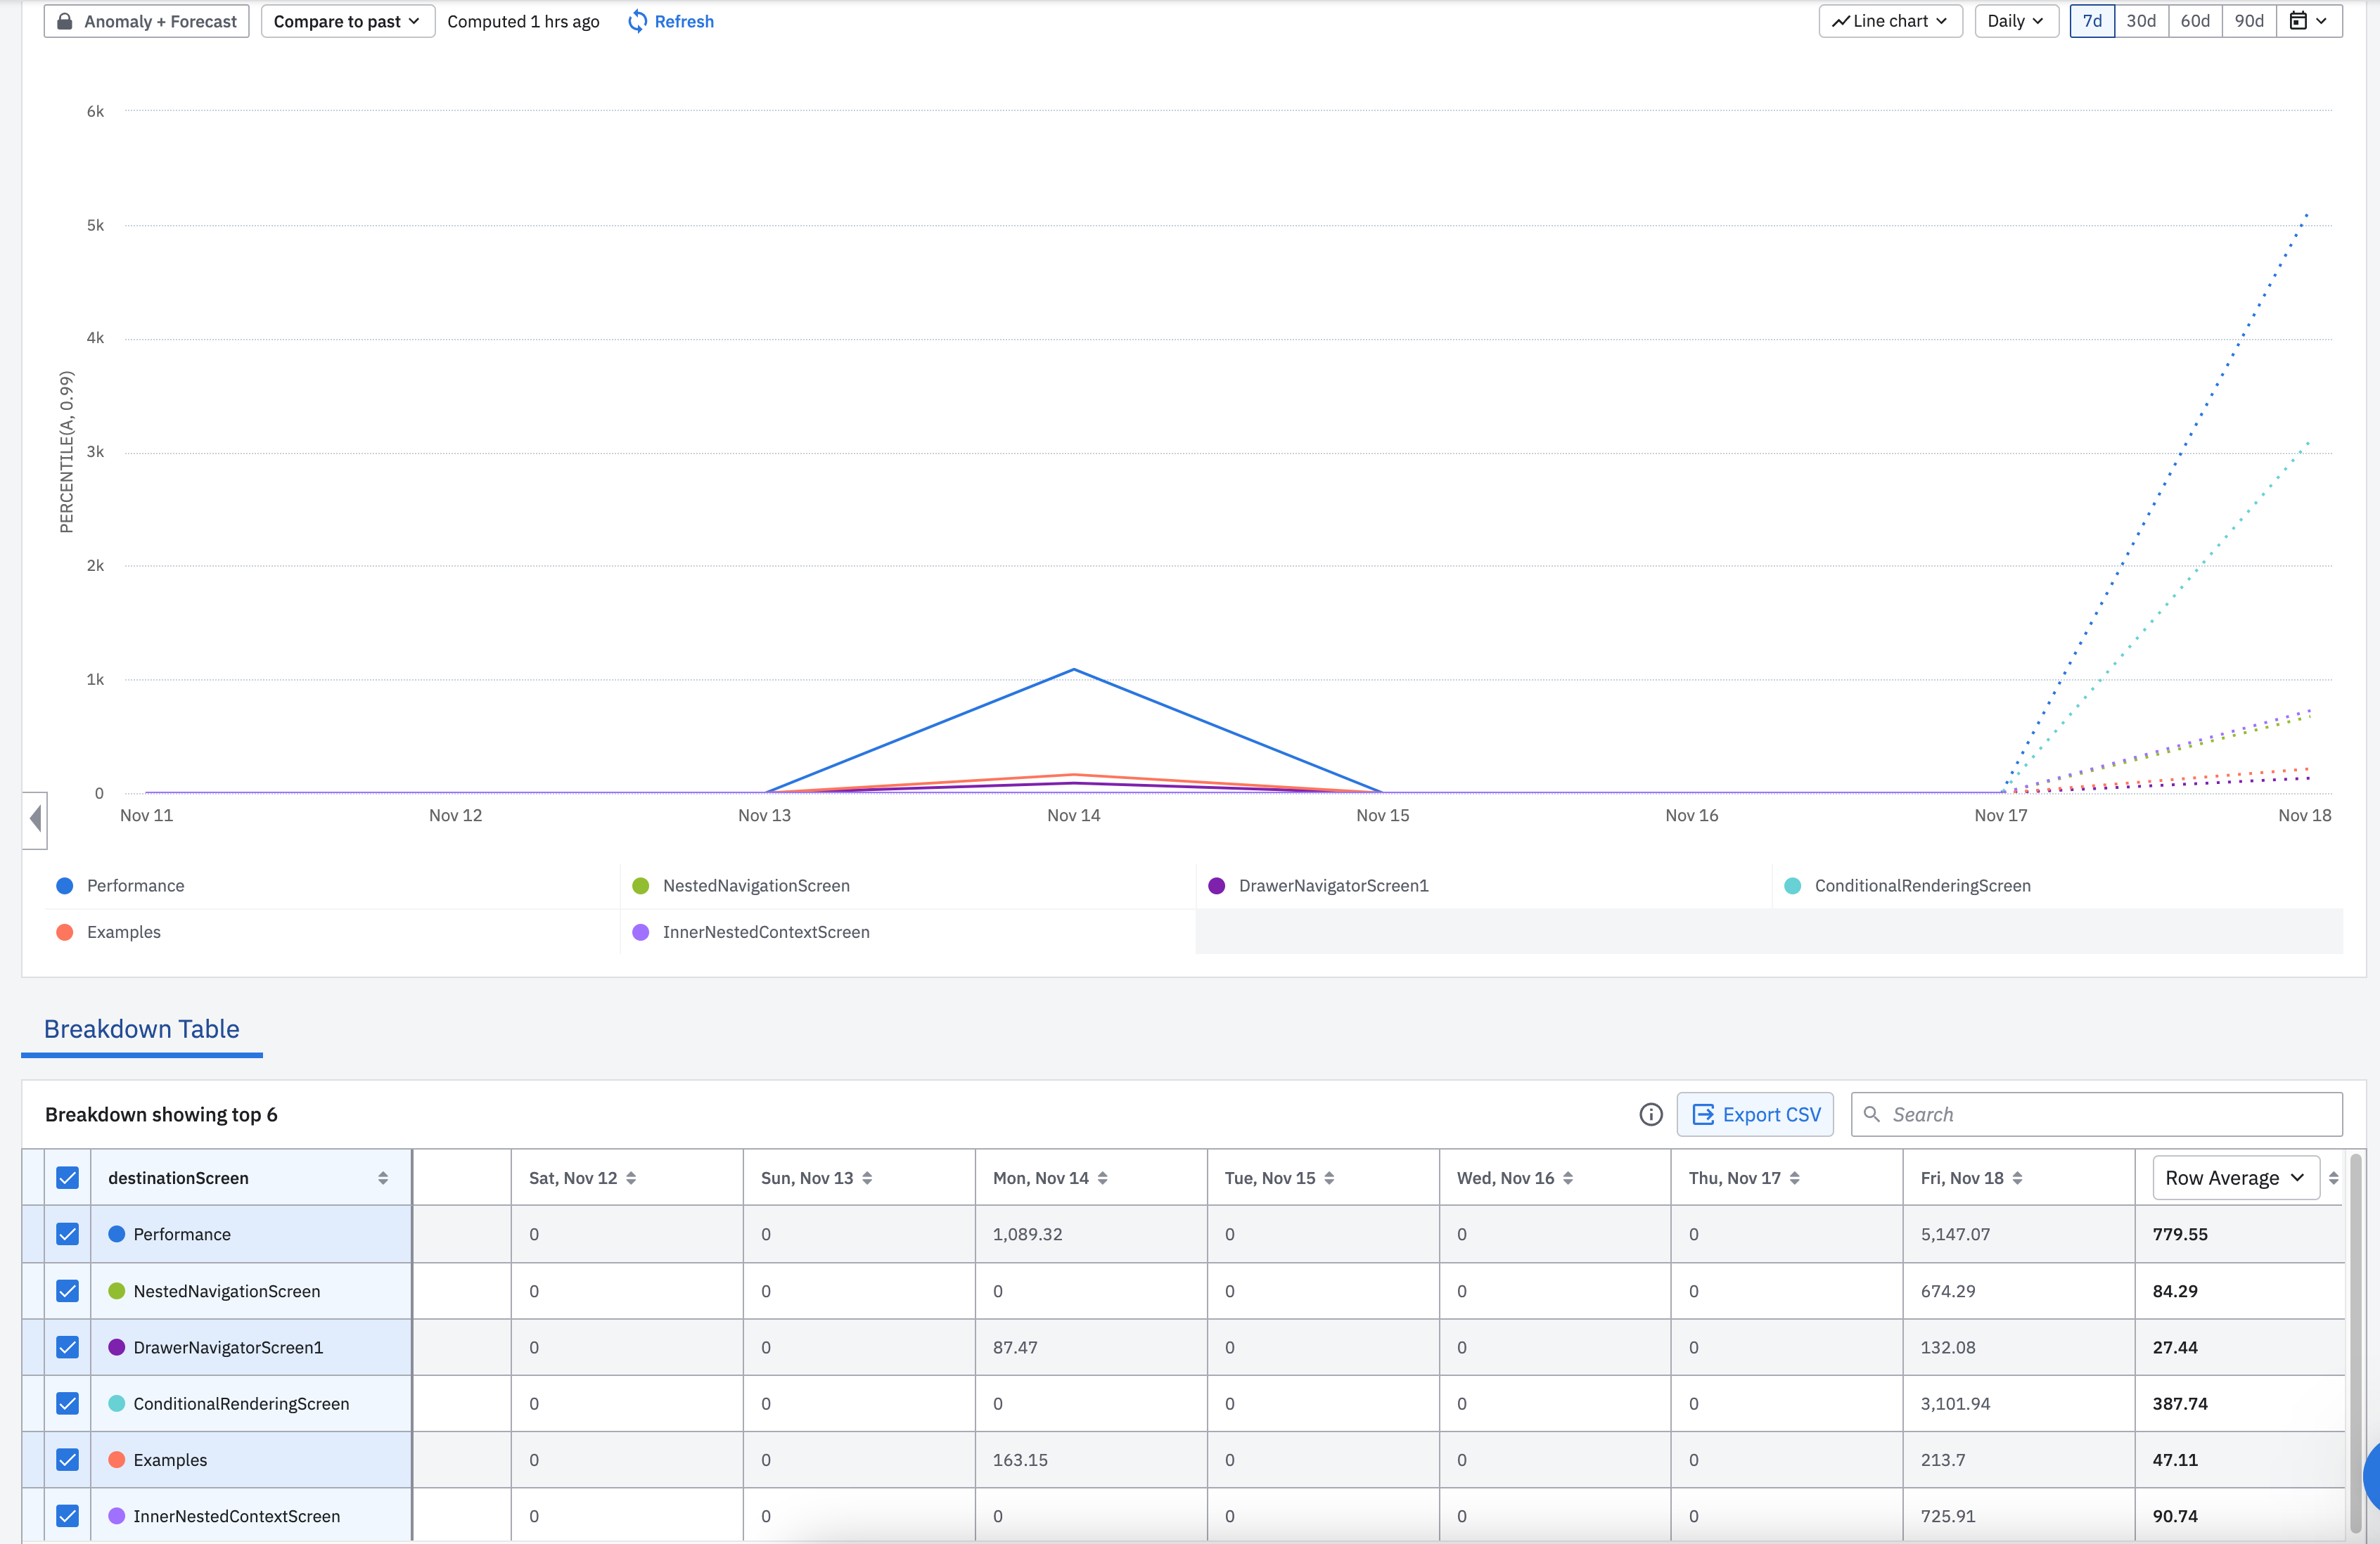
Here is an example of an Amplitude dashboard that shows us the rendering time per screen with the time. This dashboard uses events sent by a demo project that you can check out in react-native-performance-reporting-demo repo.